
Dev Tools inside your “BROWSER”.
Dev tools live inside your browser. It’s a very powerful toolkit that helps you inspect, modify, debug and see your page performance.
Let’s explore the dev tools present inside the chrome browser. We are going to use google.com with the dev tools.
For Windows users,
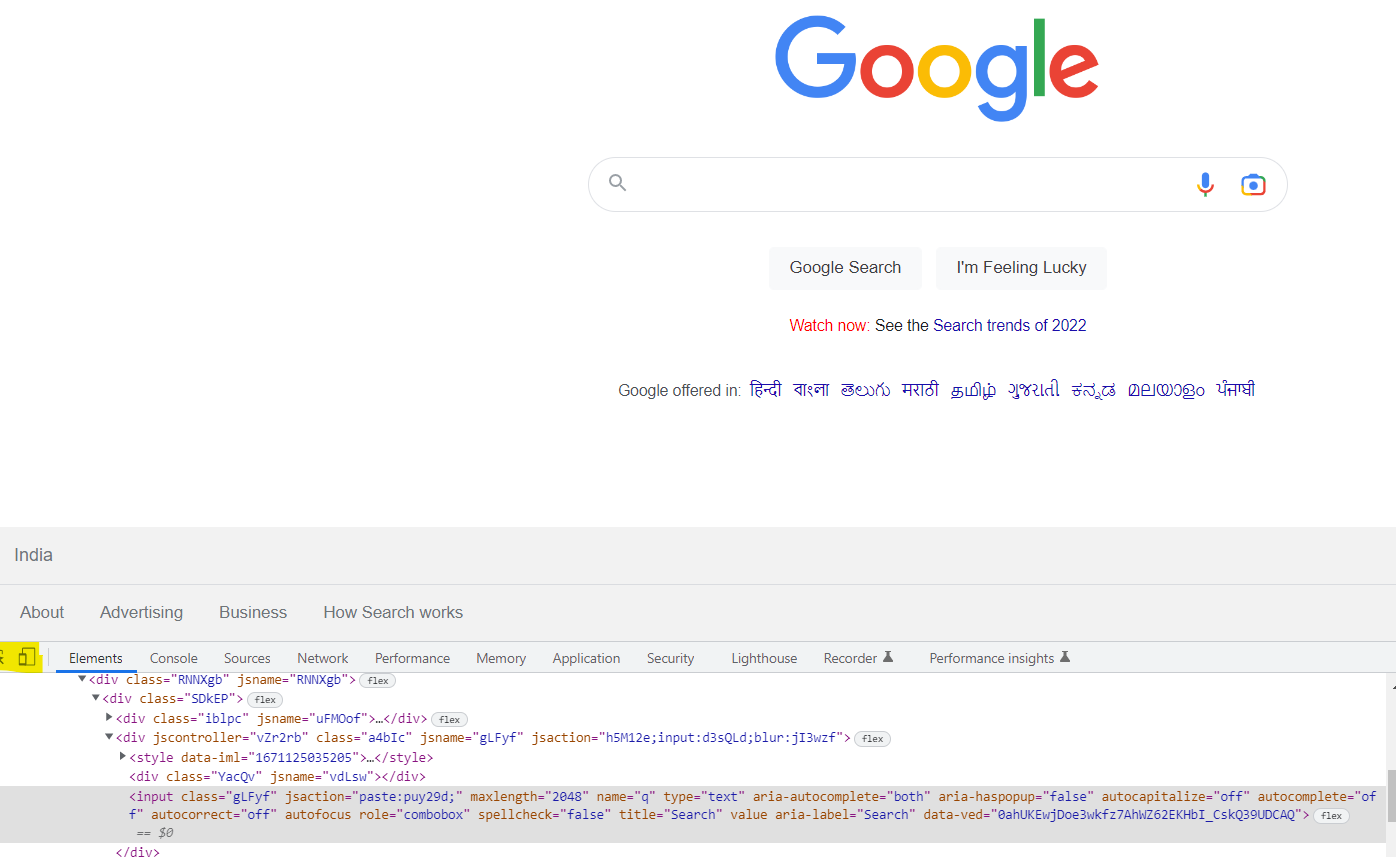
To Open Chrome Dev Tools Either press F12 from the keyboard, if your keyboard has an fn button near ctrl press fn + F12.
You can also open chrome dev tools by right-clicking on the browser page using the mouse and clicking on inspect.
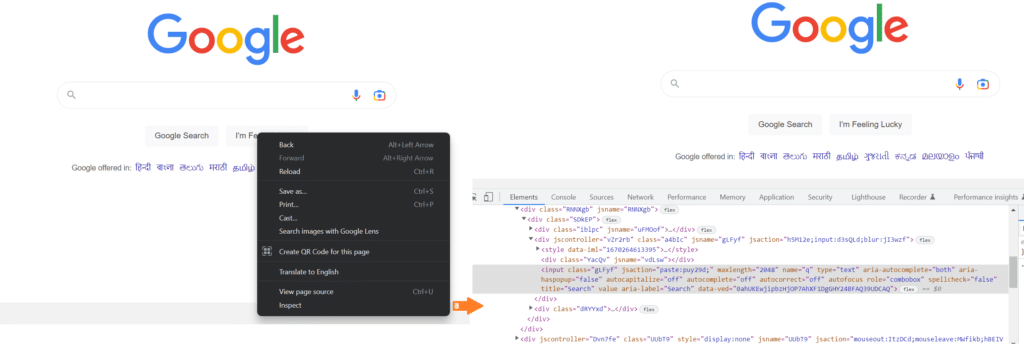
Let us explore the dev tool and understand a few elements inside it.
Inspector and Elements panel
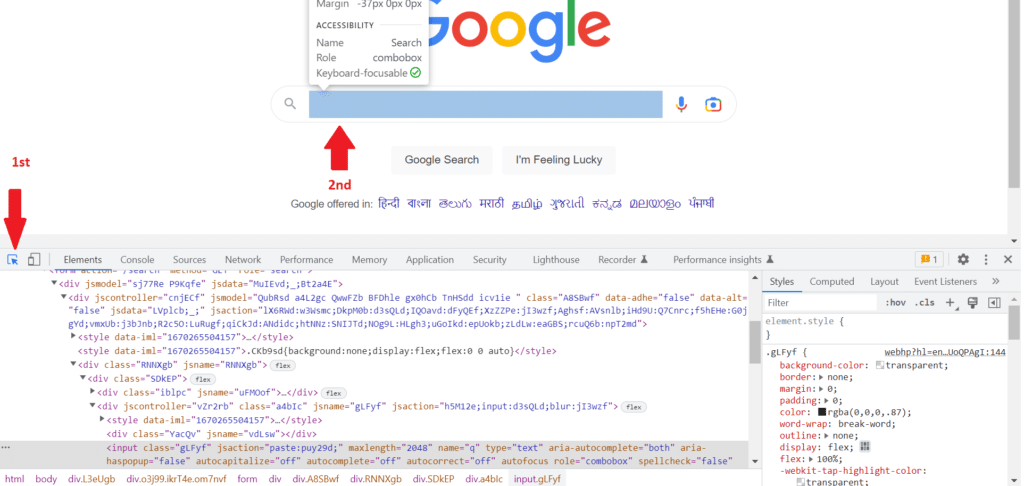
You can inspect any element on a webpage by clicking on the Arrow as marked in the screenshot, which is present on the left side of the dev tool, and then clicking anywhere on the webpage to inspect and locate the element on the webpage.
Element location can be seen in the HTML in the Elements section.
Elements Sections have DOM and CSS details of the web page.
You can edit the value of HTML, basically, you can modify the DOM at run time and see the changes on the web page.
CSS values can also be modified and manipulated.
Dock Side Dev Tool
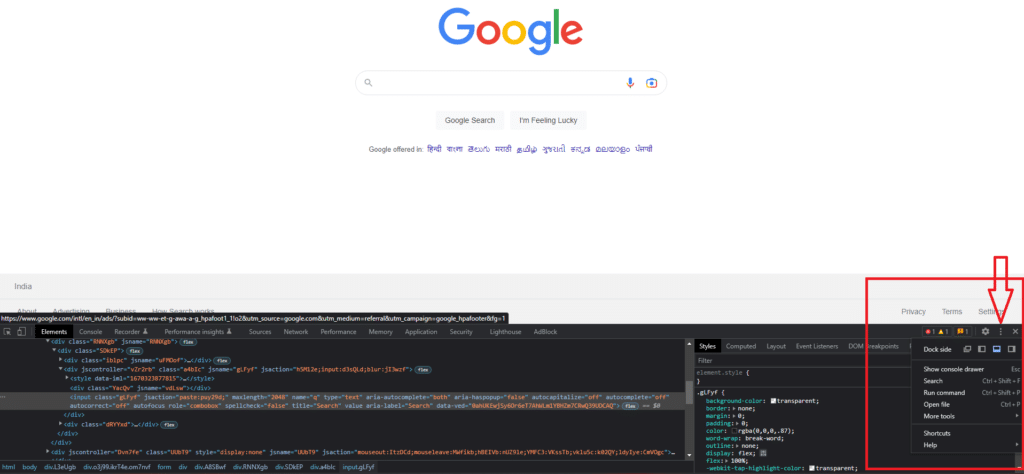
You can change the location of the dev tools that is been open by changing the dockside.
You can click on the 3 dots to the right side as shown in the screenshot and change the view of the Dev Tool.
You can also pop out the dev tool in a separate window from the dockside.
Console panel
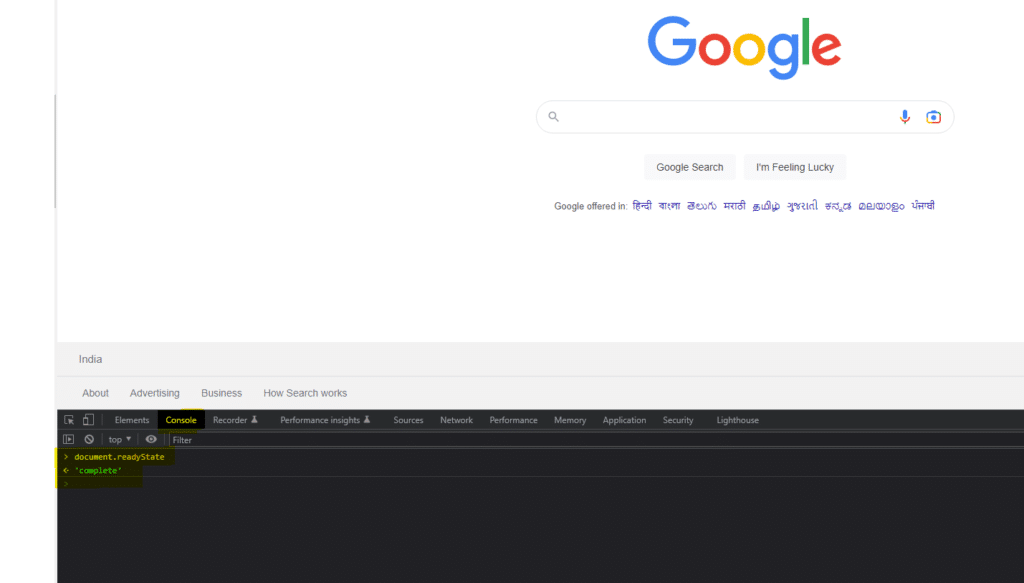
The console tab is used to see the console log errors.
Also, you can execute Javascript commands in the console.
Logged messages can also be viewed in the console tab.
Sources panel
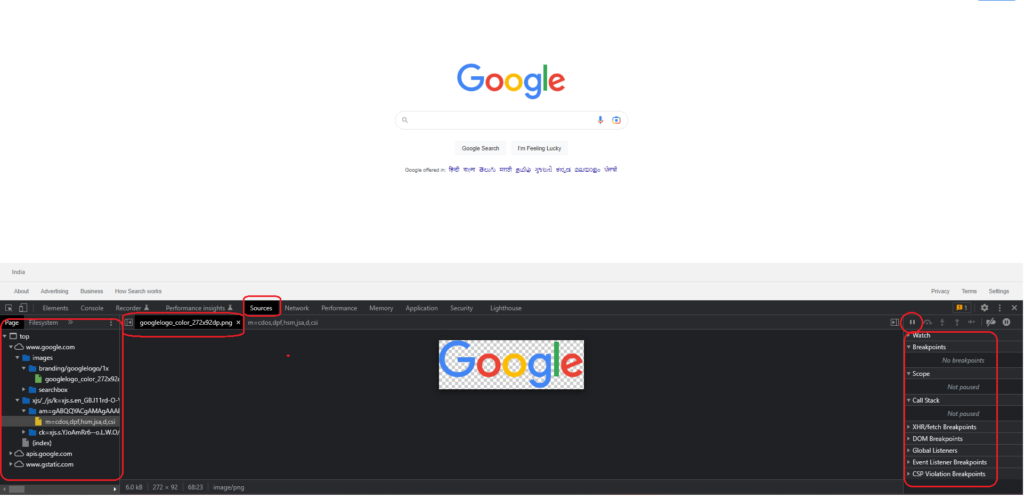
Files that are used to render the page are seen in Sources. You can also pause the execution of the page with the pause button on the right of the dev tool as highlighted in the image above.
You can debug the javascript as well.
Network panel
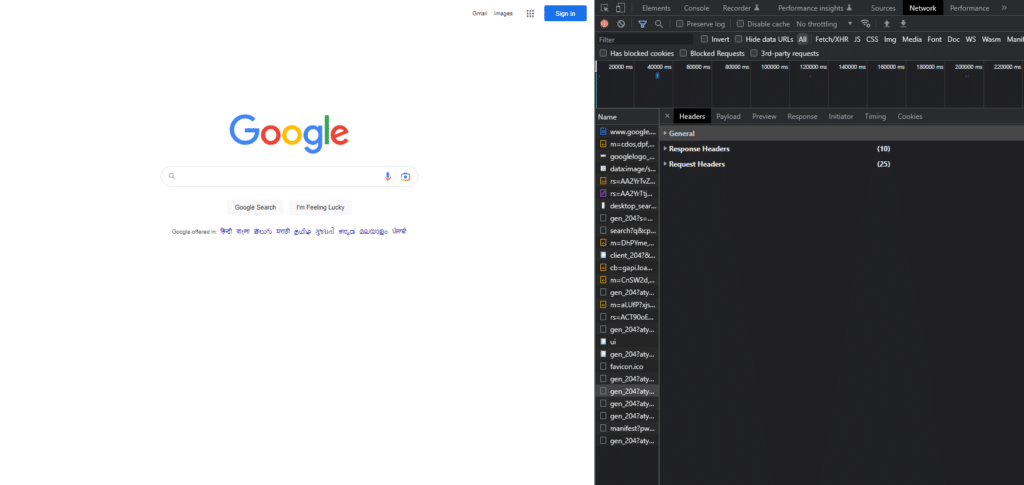
The network tab is used to evaluate the traffic that is going through the browser.
The network tab is used to view resources that are uploaded and downloaded.
You can see which requests have failed or given errors.
You can see the request sent and what response we got from the request from the network tab.
You can also throttle the network and slow down the page load to see how your website performs on a slow network.
Performance panel
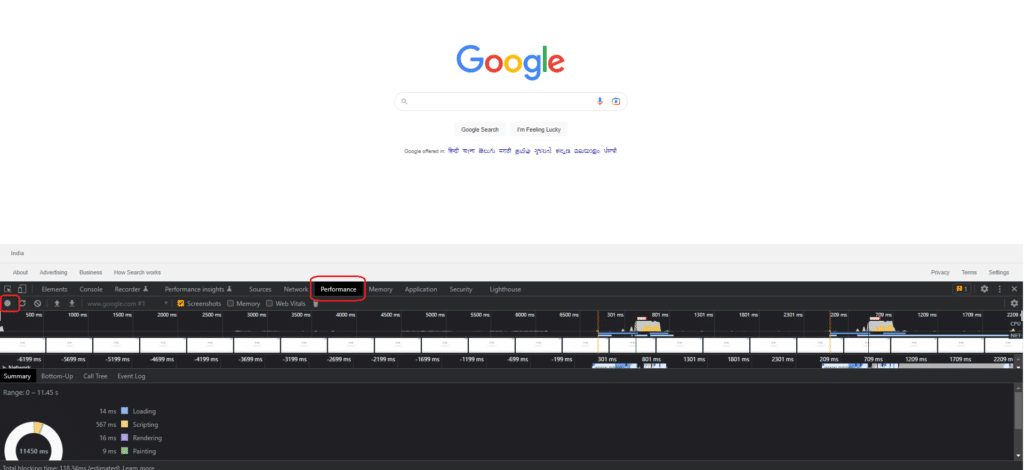
You can get to know the performance on the website.
You can throttle your CPU to slow down and see the performance of the website.
You can record the performance of the website at run time, and analyze the results.
Application panel
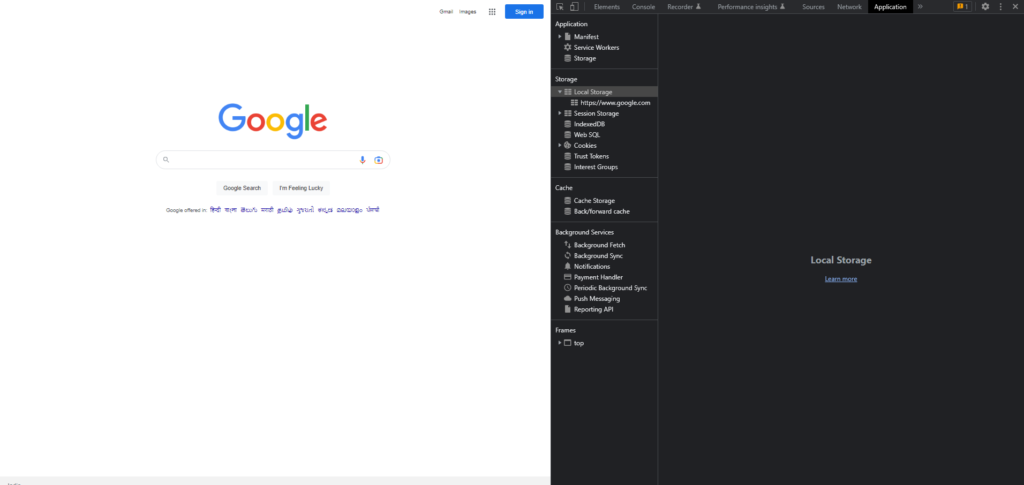
You can clear site data by going to Clear Storage.
You can view the Local Storage and Session Storage.
You can add value in Local Storage in key-value pair.
Session Storage stores the data of the session.
Toggle device toolbar
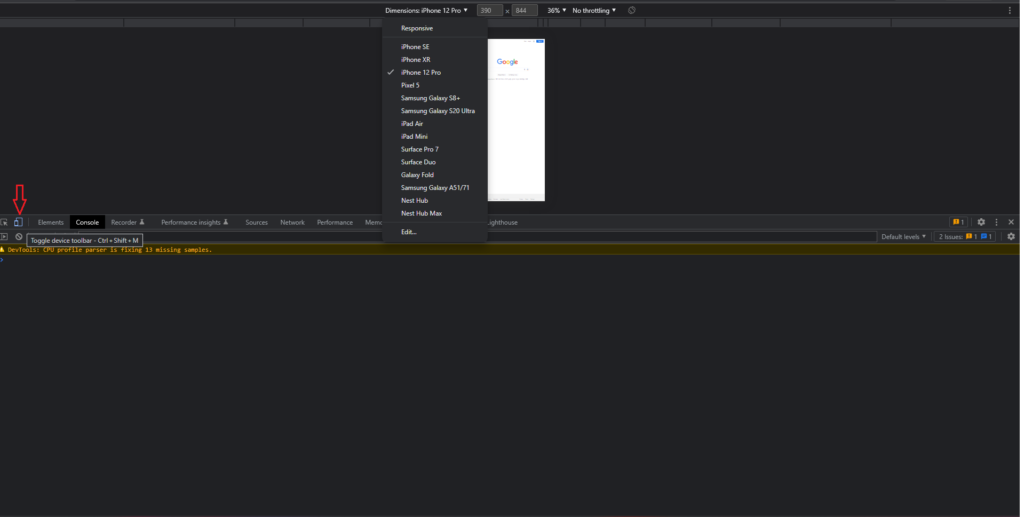
Using the toggle device toolbar you can change the view to phone Dimension.
From the dimension dropdown, you can select the view you want the page to be viewed on.
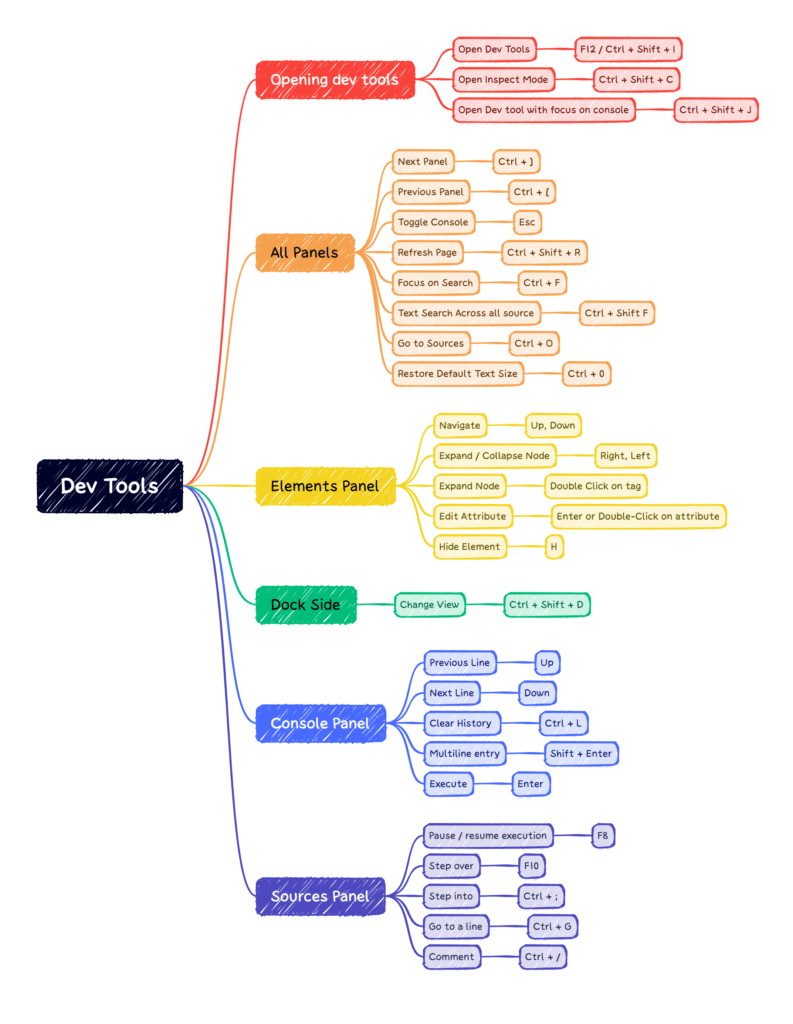
CheatSheet for ChromeDevTool
These are the few basics of Dev Tools that can help testers who are beginners and never heard about it.
Keep Learning.. !!